In a recent post I showed that how given some urls it was easy to generated a templated report as a word document. This was partly done to show how blog posts from a JISC funded programme could be used to generate reports. One of the issues with this solution is not all the projects used WordPress as their blogging platform making it harder to get at some of the data. One thought I had was rather than dictating a particular platform JISC could aggregate all programme posts in a central database. This isn’t entirely new as at CETIS we already aggregate links to posts for selected programmes via our PROD database, the difference here would be as well as a link the post content would also be ingested making it easy to query and analysis the data from a single source. As I recently wrote about in Notes on technology behind cMOOCs: Show me your aggregation architecture and I’ll show you mine this technique is common in cMOOCs, and in particular highlighted how Digital Storytelling (DS106) do this already using the FeedWordPress plugin.
As part of a double hit I thought I’d see if there was a case for JISC implementing this type of infrastructure, and because I’ve got an interest in applying learning anlaytics to open online courses, have a look at the data stored by ds106 and see what analysis I could do. In the next series of posts I share my notes and sketches around extracting FeedWordPress data, supplement it with 3rd party sources and analysing dialog/activity around posts. In this first post I’m going to outline how all the data was imported into a local WordPress database, queried to pull out a data slice, refined and mined, before visualisation/analysis. What we end up with is a view of how ds106 blog posts are interlinked by hyperlinks within the post body. For the next in the series I record some notes on comment extraction and finally how to get more activity data from social network sites.
The data source
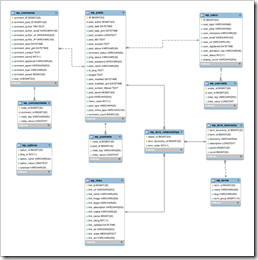
If JISC were hosting the data then in theory it would be a lot easier to get to. As my test data comes from ds106 some extra preparatory work was required. Fortunately #ds106er Alan Levine (@cogdog) was able to provide me with a MySQL dump of data from their WordPress install. The dump contained over 700,000 lines of SQL commands and was over 500Mb. Problem one was then how to get this back into a local MySQL database to make slice, dice and export easier.
For a local Apache/MySQL/PHP server I used XAMPP Lite. Importing the data wasn’t straight forward as despite tweaking the config kept having ‘allocated memory’ errors. The solution was ‘BigDump: Staggered MySQL Dump Importer’, which was able to automatically split and run the import. Even with this I got a couple of ‘MySQL has gone away’ errors so used Vim (a text editor that can handle very large files) to drop 5 blog post inserts (given ds106 had over 20,000 posts I can live with the lose).
The selected data export

SELECT wp_posts.id,
       wp_posts.post_author,
       wp_posts.post_date,
       wp_posts.post_content,
       wp_posts.post_title,
       wp_posts.post_name,
       wp_posts.guid,
       wp_postmeta.meta_value AS comment_feed,
       wp_users.display_name
FROM   wp_posts
       LEFT JOIN wp_postmeta
              ON wp_posts.id = wp_postmeta.post_id
                 AND wp_postmeta.meta_key = 'wfw:commentRSS'
       LEFT JOIN wp_users
              ON wp_posts.post_author = wp_users.id
WHERE  wp_posts.post_type = 'post'
       AND wp_posts.post_status = 'publish'
Running this query in phpMyAdmin gives us an option to exporting as a csv giving almost 20,000 blog posts (one per row) to play with which is plenty.
The refinement

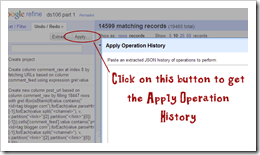
- Create column post_as_date at index 3 based on column post_date using expression grel:value.toDate(“Y-m-d H:m:s”)
- Create column outbound_links at index 5 based on column post_content using expression grel:forEach(value.parseHtml().select(“a[href~=]”),e,e.htmlAttr(“href”)).join(“|||”)
- Split multi-valued cells in column outbound_links
- Create column source_links at index 9 based on column guid using expression grel:row.record.cells[“guid”].value[0]
The key step is 3. which mines all the posts for <a href> tags and extracts them into a new column joining them together with ‘|||’
Using Refine we can split the outbound_links column to put one link per row (column dropdown, Edit cells > Split multi-valued cells). The last step is to make sure the post source link is included in each row using fill down the right and secure way. Filtering out blank outbound_link rows and Export using Custom tabular exporter (setting I used here) I get some data that looks like this:
The data meets Gephi and NodeXL
With this data we can open in Excel and then import into NodeXL using Import > From Open Workbook, more about that later, or alternatively using Gephi change the column headings in the .csv version to source and target and import via the ‘data laboratory’ tab (for graph manipulation in Gephi Tony Hirst has a great tutorial).
Sticking with Gephi for now you can generate the images below. On the left is the entire graph which depicts the ~59,000 links contained in ~20,000 ds106 blog posts. The image on the right is zoomed in to the inset where we can start seeing each webpage referenced as a dot connected by a line which is a link in a post. Whilst this is pretty, it’s also pretty useless.
So where to go with this? In the paper A Theoretical Proposal of Learning Communities Management Through the Analysis of the Organizational Blogosphere the authors propose using the measure of ‘betweenness centrality’ (BC) as a way of identifying influential learners within a blogging collective:
The betweeness centrality has been considered in literature (Marsden, 2002) as a way to find the most valuable nodes within a social network. The strategic function of these characters is fundamental for the system of learners, because they have the widest view of what happens in the net. This is due to the fact that they intercept the majority of the knowledge and information flows within the learning community. The people with the highest betweeness centrality can share their vision on the main knowledge claims of the community in an open debate.
Extrapolating this slightly lets consider individual blog posts rather than individual learners, using BC as a way to highlight posts that may bridge concepts, or support the community of learners in some way. Rather than examine all links in the blog posts lets first consider internal linking within the ds106 community.
To do this lets turn back to NodeXL which I find a lot easier to get data in and manipulate. Opening our export file from Google Refine and then using Import > From Open Workbook we can import all the data source and target being edge properties, the rest vertex 1 properties. This gives you over 75,000 connections between over 59,000 links, back at square one. A nice feature of NodeXL is to tell it to ‘skip’ some data (edge, vertex or group). The data is kept in the spreadsheet so you can include it later but it’s not used for any calculations. I only want to analysis ds106 posts that link to other ds106 posts. Here’s brief notes on the way I did it (other ways are possible and might even be better).

On the ‘Edges’ sheet in the ‘Other columns’ section I created 4 columns named: Community Link, Self Link, Combined and
Internal Link, then added the following formula in each column:
- =IF(ISERROR(VLOOKUP([@[Vertex 2]], Vertices!A:AF,30 ,FALSE)),0,IF(LEN(VLOOKUP([@[Vertex 2]], Vertices!A:AF,30, FALSE))>12,1 ,0)) – because we only have dates, titles, names for posts made by the ds106 community, if this detail is blank on the vertices sheet then the edge is outwith the community (if it exists enter 1, otherwise 0) Tip: after doing this I copied all the Community Link values and Paste Special, Values to save recalculation on edit/open.
- =IF([@[Vertex 1]]=[@[Vertex 2]],0,1) – test if edge is self-link
- =[@[Community Link]]*[@[Self Link]] – multiplying these together as a simple operator
- =IF(ISERROR(OR(FIND(“/”,[@[Vertex 1]],12), FIND(“/”,[@[Vertex 2]],12))), 0, IF(LEFT([@[Vertex 1]], FIND(“/”,[@[Vertex 1]], 12))=LEFT([@[Vertex 2]], FIND(“/”,[@[Vertex 2]],12)), 1,0)) – used to test if edge is two posts by the same author
Using the Autofill we can chose to skip edges based on the ‘Combined’ value (and while we are at it set the edge style based on the ‘Self Link’ value). Once this is done you can use NodeXL to calculate Groups and Metrics knowing that it’ll skip the edges it doesn’t need.
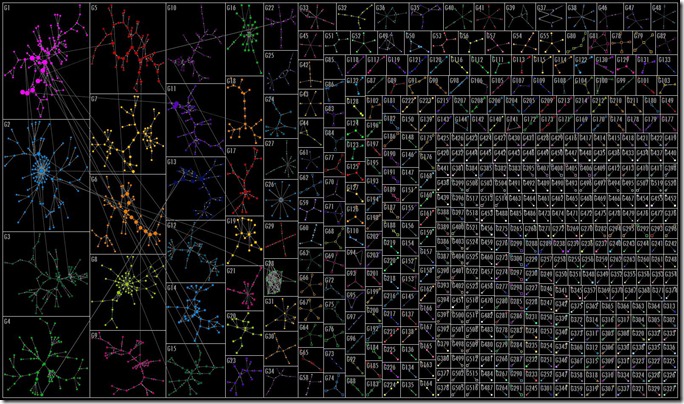
Once we’ve done all of this and applied some chart options this is the graph we get.
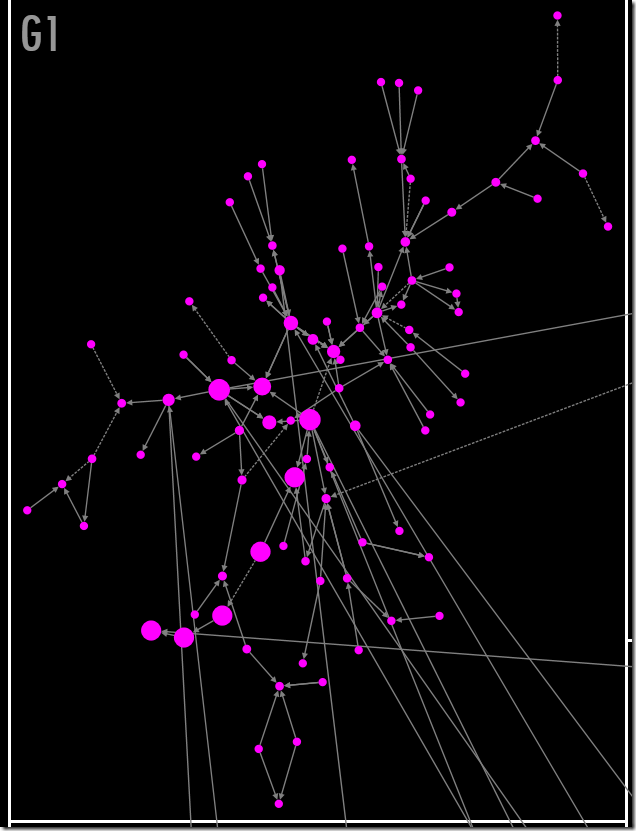
Taking a closer look at one of the groupings (G1) shown below we can see how ds106 blog posts (the dots) link to each other, a dotted line indicating it’s the same post author referring to their own work.

The first impression
We now have a dataset of ds106 blog posts and the webpages that they individually link to. There are some interesting patterns and more work to be done to interpret these. Whilst this technique has surfaced interlinks within the community there is no context in which they are made. Ranking the posts by betweenness centrality we get the following top 10:
- http://bavatuesdays.com/the-daily-shoot-and-manic-ravings-about-ds106/
- http://bavatuesdays.com/innovation-in-elearning-interview/
- http://cogdogblog.com/2011/04/13/do-you-feel-lucky-wabbit/
- http://thisevilempire.com/blog/?p=442
- http://bavatuesdays.com/the-ds106-99-15-suburbia/
- http://bavatuesdays.com/the-ds106-99-13-valley-girl/
- http://gforsythe.ca/2011/04/15/ds106radio-memory-lane/
- http://bavatuesdays.com/week-12-13-assignment-el-mashup/
- http://cogdogblog.com/2012/02/19/week-5-in-review/
- http://cogdogblog.com/2012/02/14/calling-card-bullitt/
It’s interesting that most of these come from tutors (although given the amount of co-creation the role of tutor/student is very blurred), which in some ways isn’t that surprising given they will be summarising and highlighting key work.
The Limitations
Hopefully by this point you are screaming at the screen because of the limitations of this analysis. The focus has been on blog post content, which I hope I’ve shown can be used to identify interesting moments. The big limitation here is it’s looking at a narrow slice of activity – how students are linking to blog posts without any real context. Another staple of blogs is comments. Comments provide an easy way for a reader to feedback to the author continuing the dialogue sharing thoughts, ideas and reflections. It’s also all well and good me doing this but the real interesting thing would be to put this graphical overview in the hands of tutors and students to see if it helps them. I imagine it wouldn’t be hard to wrap the MySQL query initially used in some PHP and visualisation library like d3.js and provide users with some situational awareness of what is going on in their community. If you would like to explore the data the NodeXL file is here for download.
As part of this post was also about the feasibility of using FeedWordPress to aggregate JISC project blogs here are some of my notes:
- Exporting post content was possible with MySQL access (interfaces would be easy to design)
- Issue encountered with how post links stored (blogspot/blogger feeds use a internal guid=, where as other guids are links to the original posts). This was solved by fetching the comment feed and parsing the page link from the response
- Need to be aware that FeedWordPress can’t get content for partial rss feeds but plugins are available
- Registering a feed is a manual process
- Issue with mixed-mode feeds (if you are automatically pulling in all content if the feed source has a mixed use e.g. blog is mixture of personal and work, then data isn’t as clean)
- Getting the data into Google Refine made it easy to mine post content e.g. in one expression I’d calculated that ds106 has published over 4 million words
There are other technicalities of FeedWordPress I’d want to explore like how post edits are handled. Overall it was a lot easier having a single data source.
Your Thoughts
At this point it would be very useful to have your thoughts on this technique. And remember I’m a ‘maker of things’ so your suggestions may get incorporated into a functional tool 😉
In my next post in this series I’ll share my notes on building and analysing comments data.


sarah k
This is so sweet! Good job! really cool! 🙂
Julià Minguillón
amazing work, Martin
I need to take a deep look to what you’ve shown here
best
Julià
CFHE12 Week 2 Analysis: Data! Show me your data and I’ll show you mine JISC CETIS MASHe
[…] and has got me thinking about the generation and flow of data on many levels. Having recently produced some data visualisations of ds106 for OpenEd12 it was reassuring that one of the first questions was “is the #ds106 data openly licensed?”. […]
ds106 is a Complex Universe Full of Stars - CogDogBlog
[…] dump of the entire ds106 site (some 600 MB of stuff) that he has just started analyzing that he has been running through with tools like Gephi and NodeXL. Looking at the link activity, we can see a complex universe, as Martin notes “Whilst this is […]
ds106 is Made of the Stuff the Web is Made of « WCET Frontiers
[…] I am not just arm waving at the stars here; see a timelapse reconstruction of the ds106 galaxy created by Martin Hawksey, a JISC/CETIS researcher, who created a visualization based on the export of our WordPress database processed with NodeXL. […]
The ds106 snowflake | ClintLalonde.net
[…] love this ds106 data visualization put together by Martin Hawksey at JISC. This video is a representation of the community activity that occurred in ds106 – the unMOOC […]