
Update: The Social Graph API has been deprecated by Google and Protovis is no longer being developed. I’ve revisited this recipe using new tools in Deprecated Bye-bye Protovis Twitter Community Visualizer: Hello D3 Twitter Community Visualizer with EDGESExplorer Gadget
RT @psychemedia: How do folk who send you twitter messages connect? http://bit.ly/dNoKGK < see address bar (this is depressingly good)
Was what I tweeted on the 13th April 2011. What Tony had managed to do was use the Protovis JavaScript library to let people make their own network visualizations for Twitter search terms (if you haven’t seen Tony’s other work on hashtag communities, mainly using Gephi, its well worth a read). The concept for the latest iteration was explained in more detail by Tony in Using Protovis to Visualise Connections Between People Tweeting a Particular Term.
Two limitations of this solution are: it relies on a current Twitter search which will disappear after 7 days; and it’s difficult to embed elsewhere. Tony and I had discussed collecting the data in a Google Spreadsheet using one of my many Twitter/Spreadsheet mashups and then draw the network visualization from the data.
I thought I would go one step further not only collecting the data in the Spreadsheet but then also generate the Protovis visualization in the sheet by making a gadget for it. The reason for going down the gadget route is in theory they provide an easy way to embed the visualization in other webpages and web apps.
This wouldn’t be my first foray into gadgets having already done My first Google Gadget to embed a flickr photoset with Galleria navigation, and I already knew that to gadgetize Tony’s original code just needed some xml wrapping and a dash of the Google Visualization API. In fact because I used Google Apps Script to collect the data there was very little needed to do with Tony’s code as both used JavaScript syntax.
So here it is the:
*** Protovis Twitter Community Visualizer ***
[If the link above doesn’t work open this version and File > Make a copy (make sure you are signed in)]
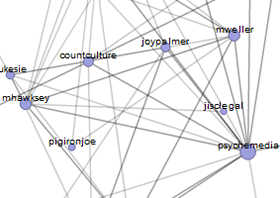
and here is some output from it (if you are reading this in an RSS aggregator you’ll need to visit this post) Update: Turns out the Protovis library doesn’t work with IE so you’ll just have to use a proper browser instead:
PS you can interact with the diagram by click-dragging nodes, using your mousescroll for zoom and click-drag empty parts to pan
Life is so much easier when you stand on the shoulders of giants 😉