In this post I’ll show you how to make a searchable Twitter contributor map like the one below in a couple of clicks, however I feel it’s my duty to educate you first…

Click here for interactive version
I’m not sure everyone is aware just how much metadata is available to developers in a tweet. Below is the data (JSON) you get back from a single tweet from the Twitter Search API.

Not all of this is particularly useful, including things like profile colour preferences (there’s a research project for you ;), but as well as the tweet text you get information back about the tweet (like who it is in response to), and the user (like their profile description). In TAGS (my Twitter Archiving Google Sheets project) you get a default set of columns which collect the metadata associated with each tweet. Most of these are there to work with the TAGSExplorer visualisation but a lot of people don’t know you can add more column names listed here to your Archive sheet to start collecting other data. A question I often get asked is when the geo_location column is added why is the data is often blank. The answer is that the majority of people don’t geotag their tweets so there is no data to include (<1.0%). Don’t be allude however that by not geo-tagging your tweet that you are not giving away your location. A 2013 study revealed that approximately 20% of tweets could be reveal the user’s location down to street level (Weidemann & Swift, 2013). One of the authors of that work, Chris Weidemann, has created geosocialfootprint.com “an educational demonstration of how public Twitter.com data can be harvested and analyzed to uncover location intelligence” to illustrate the point.
One way a location can be revealed is from the Twitter profile location field. This is an optional text field within your Twitter settings which can be collected in a TAGS sheet by adding a column with user_location.

Converting a text description of a location to co-ordinates isn’t that hard and you’ve probably experienced geocoding when using services like Google Maps. Google Maps also has a geocoder service developers can use to get co-ordinates for location descriptions. In Google Sheets there are a couple of ways you can convert location descriptions into co-ordinates. One way is Google Apps Script which hooks you straight into the Google Maps geocoder, however in this post I’ll save you the code and introduce you to Geocode by Awesome Table. This is a Google Sheets Add-on, a piece of Google Sheets customisation produced by third party developers coded using Google Apps Script. There are actually a couple of free geocoders in the Add-on store so you might want to check those out as well. For Geocode by Awesome Table to work we need to get our data in the right shape and the steps below will help you do that:
Setting up a TAGS Archive for geocoding
- First you need some tweets to geocode which you can do by getting a copy of TAGS – you can use either version 6.0 or 6.1 (existing users might want to stick with 6.0, while new users will find the setup easier in 6.1)
- In your copy of TAGS make sure there is a
user_locationcolumn at Column P the Archive sheet (in TAGS v6.1user_locationis already included) - Enter your search term in the Readme/Settings sheet and from the drop down menu select TAGS > Run Now!
- Open this ‘Location’ template and from the sheet tab at the bottom select ‘Copy to…’ and select your new TAGS archive as the destination


At this point you ‘Copy of Location’ sheet is populated with the screen names that have tweeted the most in your archive and also have a user_location entry:


Unleashing the awesome with Geocode by Awesome Table
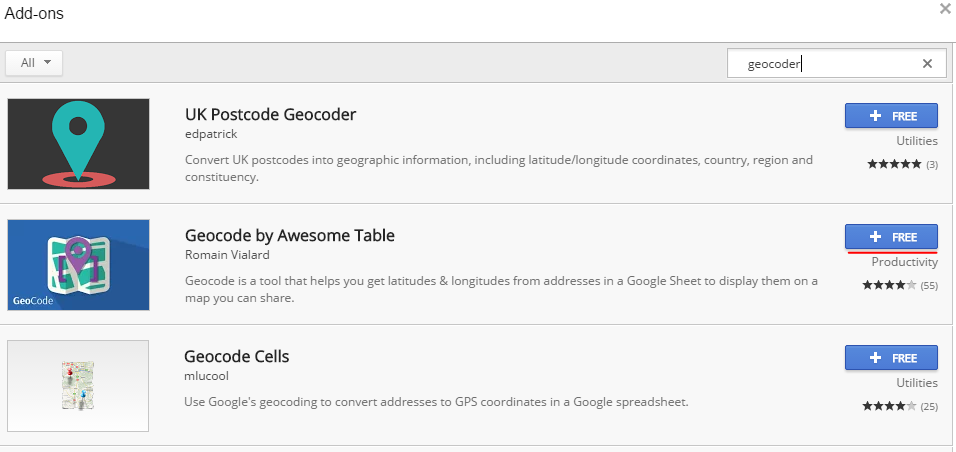
- In your Google Sheet select Add-ons > Get add-ons… and search for ‘geocoder’ clicking the ‘Free’ button for Geocode by Awesome Table

- You should be prompted with a permissions window and if you are happy click on ‘Allow’
- Give it a couple of seconds to let the add-on install and then you can click Add-ons > Geocode by Awesome Table > Start Geocoding

- A sidebar should popup which should let you pick your sheet and the
user_locationcolumn
- Hit ‘Geocode’ at the bottom of the sidebar and watch has the latitude and longitude columns start to fill.
- When finished click ‘Create Map’


At this point you can open the map you’ve created which should include your geocoded points. If you’d like to change the popup when you click on the map makers go back to your sheet and from the sidebar click the ‘Customize Tooltip’ button. I use the ‘Edit as HTML’ option with the following markup:
Screen name: ${"from_user"}

Location: ${"user_location"}

Tweets: ${"tweets."}

Followers: ${"followers"}

At this point your Awesome Table map is only visible to you and anyone else you have shared your Google Sheet with. To make public you need to share your Google Sheet so that ‘anyone can view’ from the share button.
Limitations
A couple of things to keep in mind:
- A couple of things to be aware of. If you set your TAGS sheet you automatically update every hour your map will start putting pointers in the wrong place (this is because the Locations sheet is dynamically populated). You can do a manual update using TAGS > Run Now! followed by steps 3-5 above.
- Geocoding is also not 100% accurate and co-ordinates returned are the most likely hit. The geocoder also occasionally misses obvious hits … what can I say.
- Geocode by Awesome Table will also only geocode up to 100 places at a time. I’ll let you figure ways around this.
- This is only locating the profile location not where the tweet was actually sent
Summary
So there you go … I know where you live(ish). And yes companies are using this technique but on a much bigger scale all of the time … Don’t have nightmares, do sleep well
Weidemann, C., & Swift, J. (2013). Social media location intelligence: The next privacy battle-an arcgis add-in and analysis of geospatial data collected from twitter. com. International Journal of Geoinformatics, 9(2).